1QFY2017 Result Update | HFC
July 26, 2016
Dewan Housing Finance Corporation
BUY
CMP
`225
Performance Highlights
Target Price
`270
Particulars (` cr)
1QFY17 4QFY16
% chg (qoq) 1QFY16
% chg (yoy)
Investment Period
12 months
NII
483
486
(0.6)
418
15.5
Pre-prov. profit
348
333
4.5
293
18.6
Stock Info
PAT
201
190
6.2
173
16.2
Source: Company, Angel Research
Sector
HFC
For 1QFY2017, Dewan Housing Finance Corporation (DHFL) reported a 16%
Market Cap (` cr)
6,568
growth in PAT to `201cr, which is in line with our expectation. There has been a
Beta
1.6
decline in the company’s cost structure after many quarters, which we believe is
sustainable and would add to earnings growth going ahead. At the operating
52 Week High / Low
268/140
level, the performance remained decent.
Avg. Daily Volume
2,002,386
Loan growth remains decent: The company’s AUM as of 1QFY2017 end was up
Face Value (`)
10
20% on a yoy basis at `72,012cr. While sanctions grew by a moderate 12% yoy,
disbursements at `6,215cr witnessed a strong 26% yoy growth during the quarter.
BSE Sensex
28,095
The company securitized loans worth `1,152cr during the quarter and the
Nifty
8,635
portfolio of securitized loans accounted for 12% of the total AUM.
Reuters Code
DWNH.BO
Project loans growing faster than the overall loan portfolio: Loans to individuals
which account for ~71.5% of the AUM, grew by 15.2% yoy during the quarter.
Bloomberg Code
DEWH.IN
The company continued to aggressively expand its non-individual loan book,
which is evident from the 93% yoy growth in loans to projects. The segment
accounted for 9.8% of the AUM compared to 9% at the end of 4QFY2016 and vs
Shareholding Pattern (%)
6.1% in 1QFY2016. We believe the company will continue to expand the high
yielding developer loan book in the near term.
Promoters
34.9
Asset quality marginally weakened but still comfortable: DHFL has been able to
MF / Banks / Indian Fls
2.6
maintain a stable asset quality over the last few quarters. During the quarter
FII / NRIs / OCBs
32.2
under review, GNPAs rose to 0.98% vs 0.93% as at the end of 4QFY2016. On a
yoy basis, provisions were up 41%, which we feel is reasonable, looking at the
Indian Public / Others
30.3
strong growth in non-individual loan book which is subject to stricter regulatory norms
in terms of provisioning. NPAs from the individual loans segment stood at 0.74%
while that from the non-individual segment stood at 1.24% (LAP, Project Loans, and
Abs. (%)
3m
1yr
3yr
SME combined). We don’t expect any deterioration in asset quality in the near term.
Sensex
7.6
(2.5)
38.0
Margins as well as return ratios likely to remain stable: Though the cost of funds
has declined, the yield too has come down in the last quarter due to competitive
DHFL
9.8
(4.7)
192.2
intensity. This resulted in the NIM declining to 2.91% compared to 2.96% in
4QFY2016. We believe increasing exposure to the high yielding project loans and
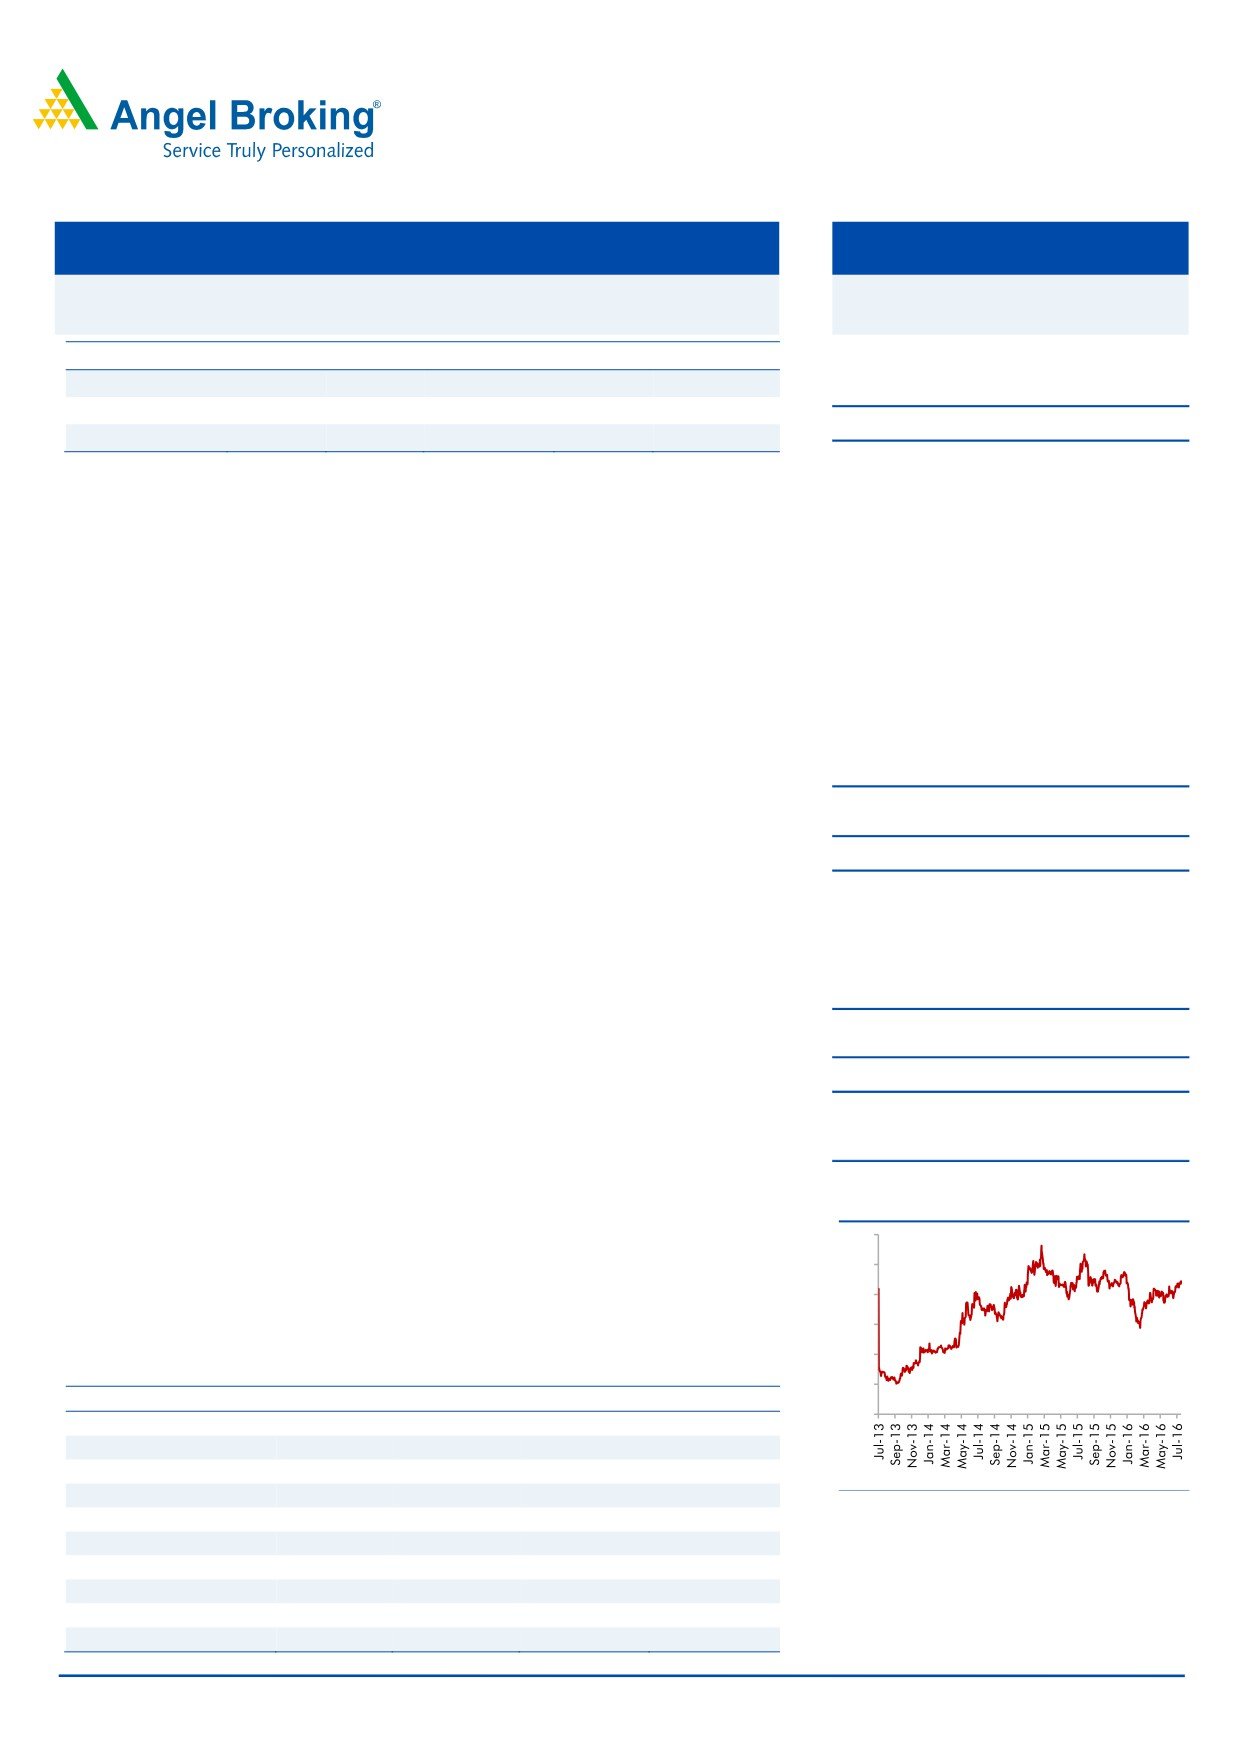
3-Year Daily Price Chart
LAP portfolio will enable the company to maintain its NIM above 2.9% levels.
300
Outlook and valuation: We expect the company to post a healthy loan book
250
CAGR of 20% over FY2015-18E which is likely to translate in an earnings CAGR
of 21.3% over the same period. Despite a 19% run up in the stock price since we
200
initiated coverage, the stock is still attractively valued at a little above 1x FY2018E
150
ABV. We maintain our BUY on the stock and retain our target price of `270.
100
Key financials (standalone)
50
Y/E March (` cr)
FY2015
FY2016
FY2017E
FY2018E
0
NII
1,256
1,664
2,050
2,500
% chg
41.5
32.5
23.2
21.9
Net profit
620
729
866
1,084
% chg
17.8
17.7
18.5
25.3
Source: Company, Angel Research
NIM (%)
2.8
2.9
2.9
2.9
EPS (`)
21.3
24.9
29.7
34.6
P/E (x)
10.6
9.0
7.6
6.5
P/ABV (x)
1.6
1.4
1.2
1.0
Siddharth Purohit
RoA (%)
1.3
1.2
1.1
1.2
022 - 3935 7800 Ext: 6872
RoE (%)
15.1
14.7
15.4
16.2
Source: Company, Angel Research; Note: CMP as of July 25, 2016
Please refer to important disclosures at the end of this report
1
Dewan Housing Finance | 1QFY2017 Result Update
Exhibit 1: 1QFY2017 performance (standalone)
Particulars (` cr)
1QFY17
4QFY16
% chg (qoq)
1QFY16
% chg (yoy)
FY2016
FY2015
% chg
Interest earned
1,958
1,964
(0.3)
1,652
19.0
7,312
5,979
22.0
Interest expenses
1,475
1,479
(0.2)
1,234
19.5
5,490
4,460
23.1
Net interest income
483
486
(0.6)
418
15.5
1,822
1,519
19.9
Non-interest income
1
2
(50.0)
1
10.6
5
3
82.4
Operating income
484
488
(0.8)
419
15.5
1,827
1,522
20.0
Operating expenses
136
155
(12.2)
126
8.4
550
474
15.9
Pre-prov. profit
348
333
4.5
293
18.6
1,277
1,048
21.9
Provisions & cont.
45
50
(10.0)
32
40.6
175
105
66.7
PBT
303
283
7.0
261
15.9
1,102
943
16.9
Prov. for taxes
102
93
8.7
88
15.2
373
322
15.9
PAT
201
190
6.2
173
16.2
729
621
17.4
EPS (`)
6.9
6.5
6.2
5.9
16.1
24.9
21.3
16.9
Cost-to-income ratio (%)
28.1
31.8
30.0
30.1
31.1
Effective tax rate (%)
33.5
33.0
33.7
33.8
34.1
Source: Company, Angel Research
Loan growth remained decent: The company’s AUM as of 1QFY2017 end was up
20% on a yoy basis at `72,012cr. While sanctions grew by a moderate 12% yoy,
disbursements at `6,215cr witnessed a strong 26% yoy growth during the quarter.
The company securitized loans worth `1,152cr during the quarter and the portfolio
of securitized loans accounted for 12% of the total AUM.
Project loans continued to grow faster than overall loan: Loans to individuals which
account for ~71.5% of the AUM, grew by 15.2% yoy during the quarter. The
company continued to aggressively expand its non-individual loan book, which is
evident from the 93% yoy growth in loans to projects. The segment accounted for
9.8% of the AUM compared to 9% as at the end of 4QFY2016 and vs 6.1% in
1QFY2016. We believe the company will continue to expand the high yielding
developer loan book in the near term.
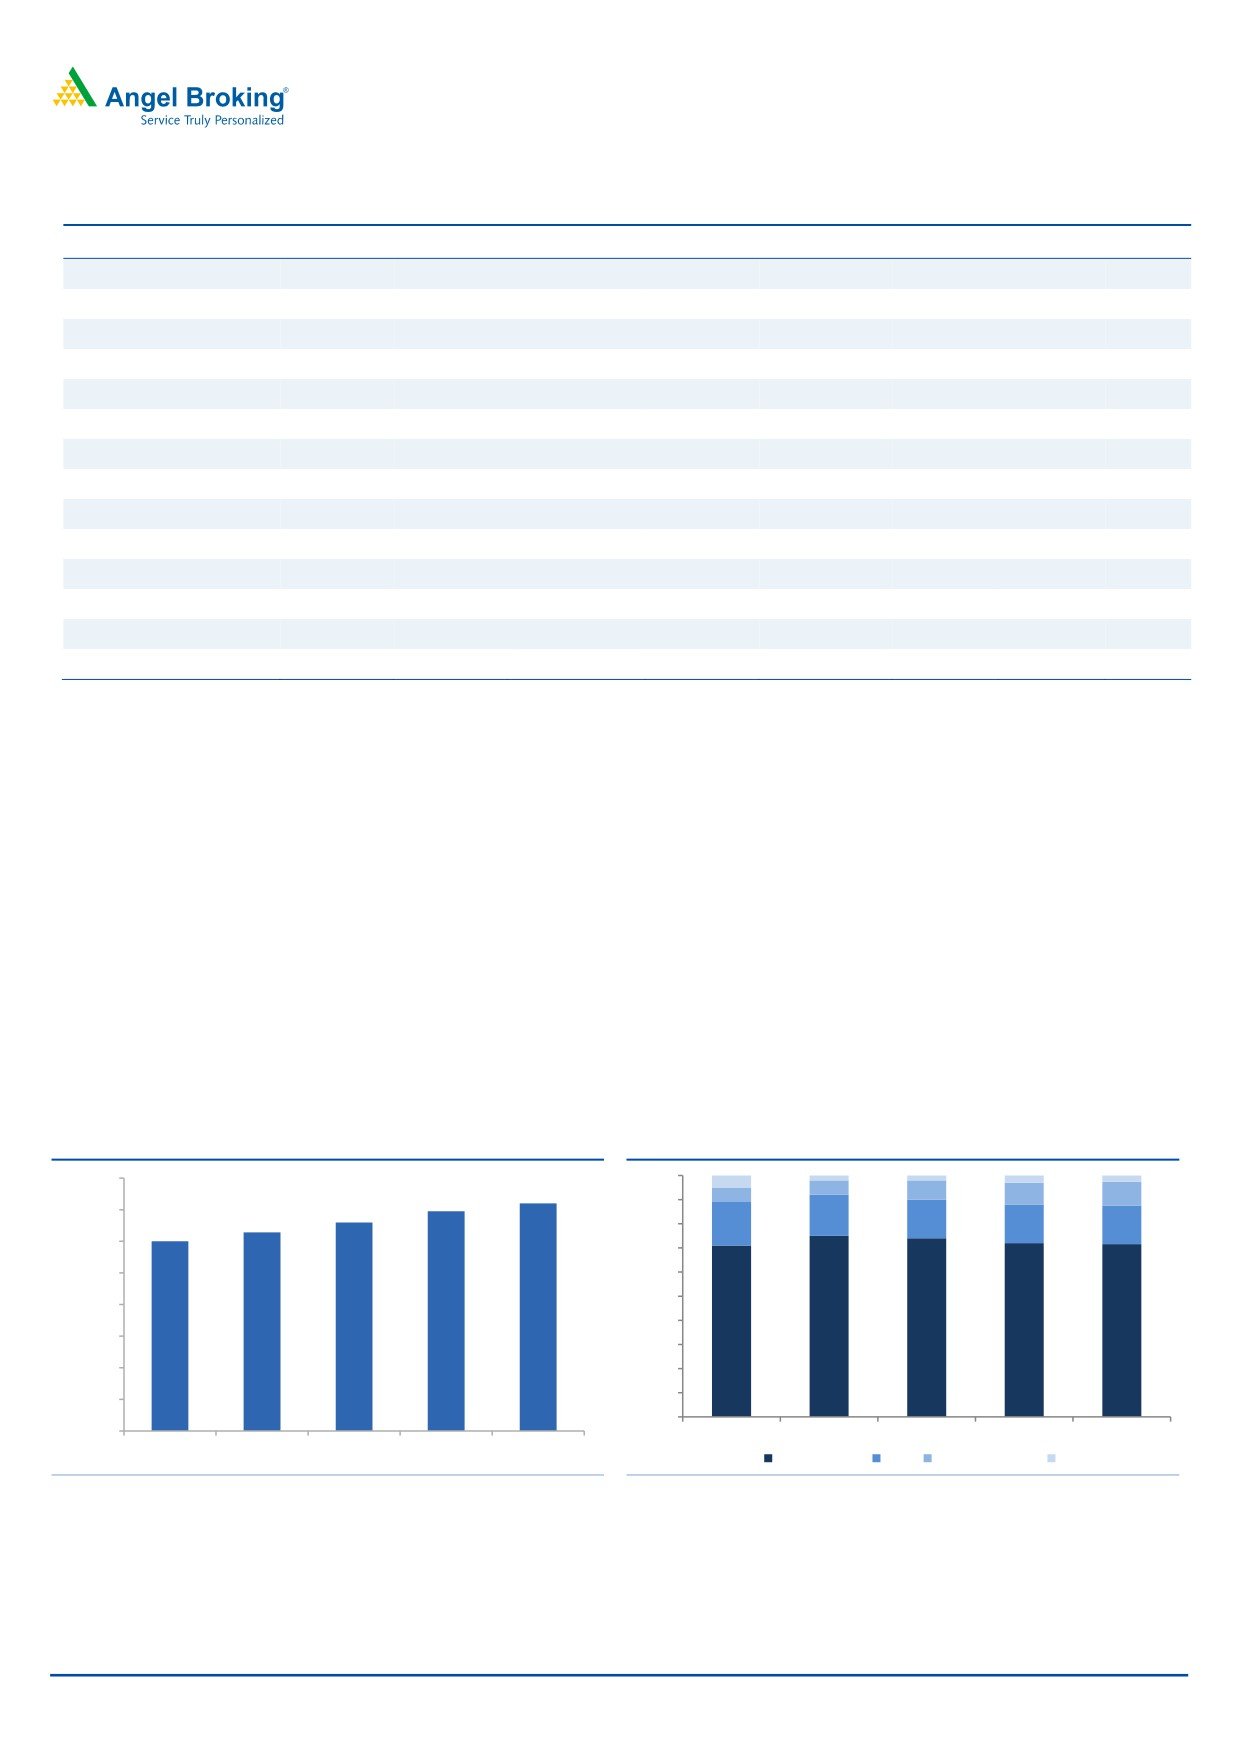
Exhibit 2: AUM growth remains strong
Exhibit 3: Loan Mix
80,000
100%
72,012
6%
8%
69,524
6%
9%
10%
65,962
90%
70,000
62,837
17%
16%
60,002
80%
18%
16%
16%
60,000
70%
50,000
60%
50%
40,000
40%
71%
75%
74%
72%
72%
30,000
30%
20,000
20%
10%
10,000
0%
-
1QFY16
2QFY16
3QFY16
4QFY16
1QFY17
1QFY16
2QFY16
3QFY16
4QFY16
1QFY17
Home Loans LAP Project Finance
Others
Source: Company, Angel Research
Source: Company, Angel Research
July 26, 2016
2
Dewan Housing Finance | 1QFY2017 Result Update
Margins as well as return ratios likely to remain stable: Though the cost of funds
has declined, the yield too has come down in the last quarter due to competitive
intensity. This resulted in the NIM declining to 2.91% compared to 2.96% in
4QFY2016. We believe increasing exposure to the high yielding project loans and
LAP portfolio will enable the company to maintain its NIM above 2.9% levels. We
estimate the company to deliver a ROA of 1.2% and ROE of 16% by FY2018.
The company received a refund of `250cr from a developer after a change in the
latter’s construction plans who now expects to complete the construction in
2-3 years. The release of funds and completion of the building would be a positive
development for the company.
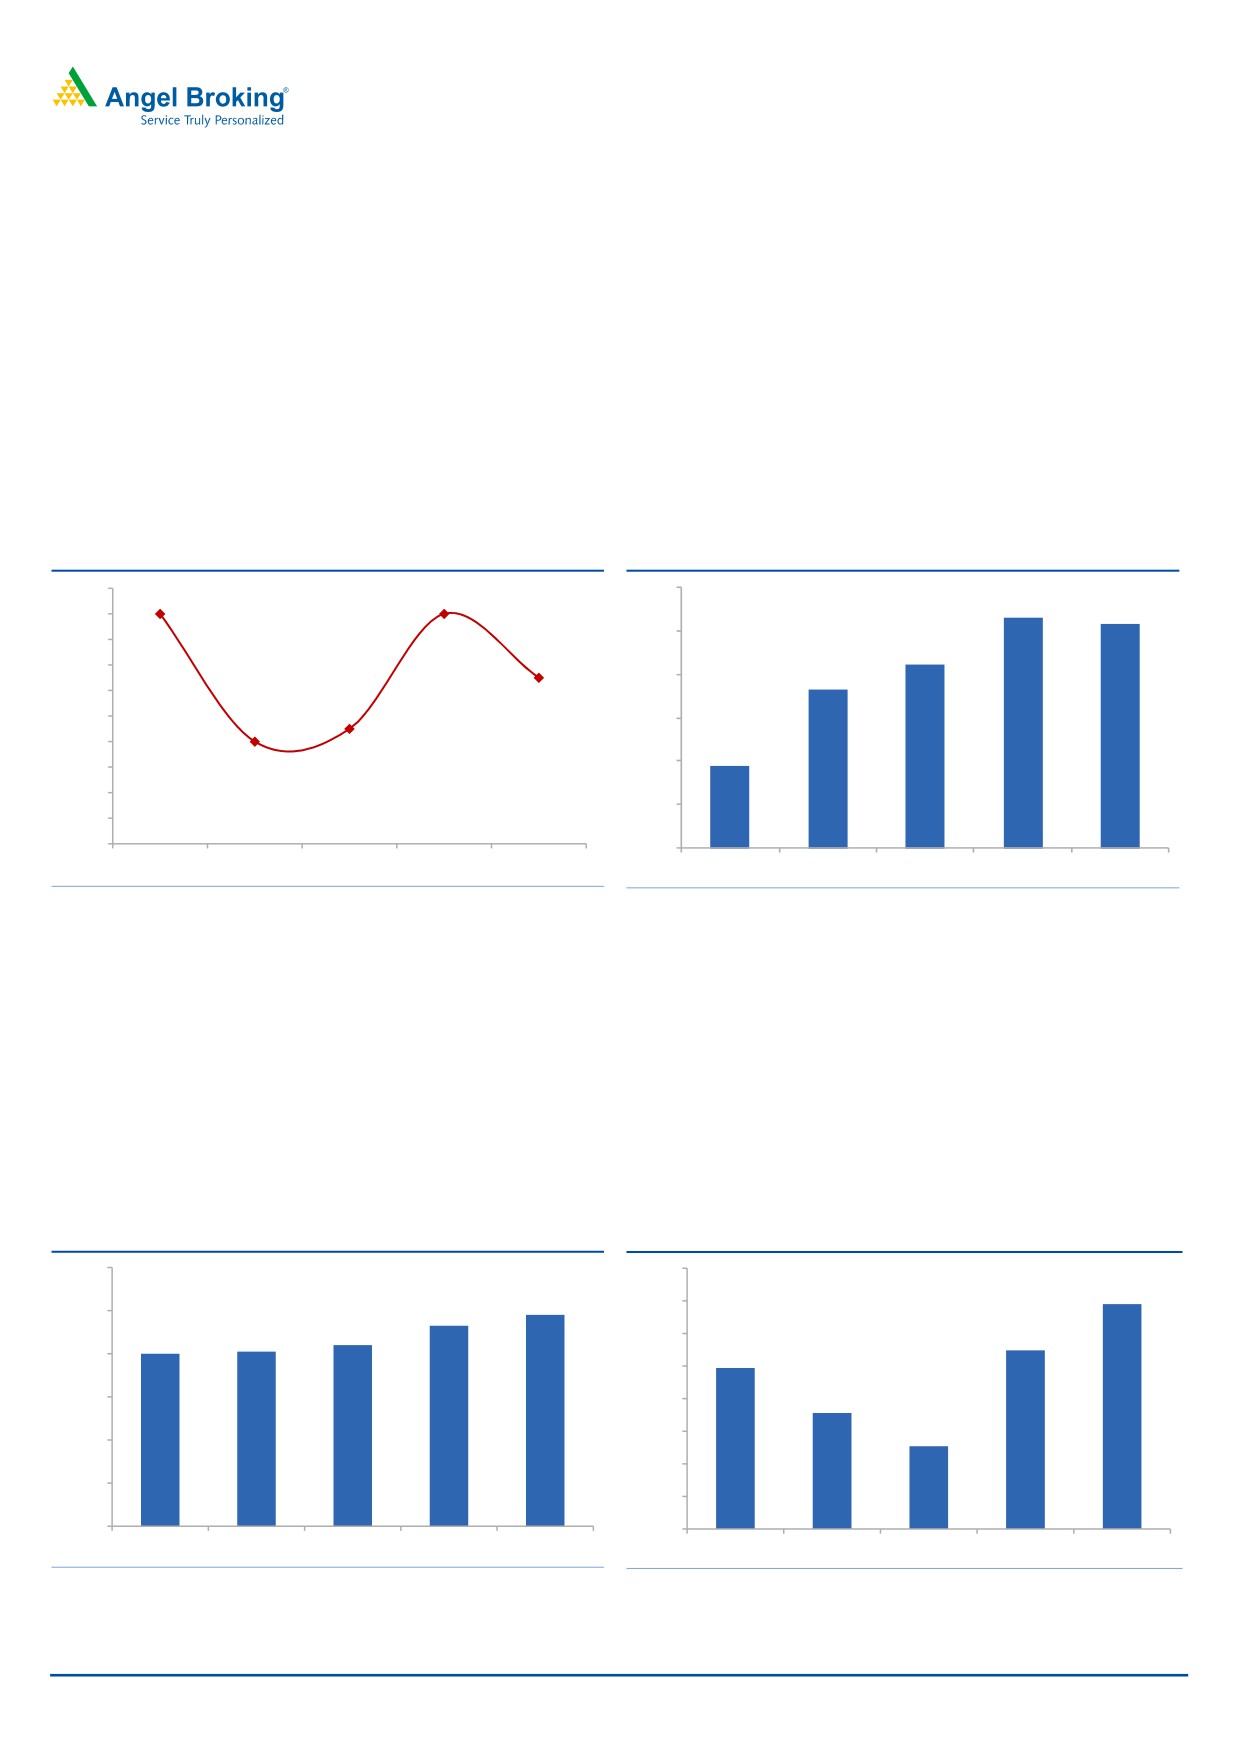
Exhibit 4: Marginal decline in NIM
Exhibit 5: NII growth trend remains healthy
500
2.98%
486
483
2.96%
2.96%
2.96%
480
2.94%
465
2.92%
2.91%
460
453
2.90%
2.88%
440
2.87%
2.86%
2.86%
418
420
2.84%
2.82%
400
2.80%
2.78%
380
1QFY16
2QFY16
3QFY16
4QFY16
1QFY17
1QFY16
2QFY16
3QFY16
4QFY16
1QFY17
Source: Company, Angel Research
Source: Company, Angel Research
Asset quality marginally weakened but still comfortable: DHFL has been able to
maintain a stable asset quality over the last few quarters. During the quarter under
review, GNPAs rose to 0.98% vs 0.93% as at the end of 4QFY2016. On a yoy
basis, provisions were up 41%, which we feel is reasonable, looking at the strong
growth in non-individual loan book which is subject to stricter regulatory norms in
terms of provisioning. NPAs from the individual loans segment stood at 0.74%
while that from the non-individual segment stood at 1.24% (LAP, Project Loans,
and SME combined). We don’t expect any deterioration in asset quality in the near
term.
Exhibit 6: Asset quality weakened marginally
Exhibit 7: Adequately Capitalised
1.20%
18.0%
17.5%
0.98%
17.5%
1.00%
0.93%
0.84%
0.80%
0.81%
17.0%
16.7%
0.80%
16.5%
16.5%
0.60%
16.0%
15.8%
15.3%
15.5%
0.40%
15.0%
0.20%
14.5%
0.00%
14.0%
1QFY16
2QFY16
3QFY16
4QFY16
1QFY17
1QFY16
2QFY16
3QFY16
4QFY16
1QFY17
Source: Company, Angel Research
Source: Company, Angel Research
July 26, 2016
3
Dewan Housing Finance | 1QFY2017 Result Update
Outlook and valuation
We expect the company to post a healthy loan book CAGR of 20% over
FY2015-18E which is likely to translate into an earnings CAGR of 21.3% over the
same period. Despite a 19% run up in the stock price since we initiated coverage,
the stock is still attractively valued at a little above 1x FY2018E ABV. We maintain
our BUY on the stock and retain our target price of `270.
Company Background
DHFL was established in 1984 by late Shri Rajesh Kumar Wadhawan. The
company is a dominant player in niche markets (tier II & III cities) with strong
foothold in the limited competition low and middle income (LMI) segment. After the
acquisition and merger of First Blue Home Finance, DHFL also now caters to the
middle and upper middle income group. The company operates in the mortgage
financing business where the growth and asset quality have remained healthy over
the past few years.
The company has emerged as a one-stop-shop for its customers’ financial needs,
extending beyond home loans. It has a presence in education loans, life insurance,
and mutual funds segments through Avanse Education Loans, DHFL Pramerica Life
Insurance and DHFL Pramerica Asset Managers Pvt Ltd, respectively.
It is India’s third largest private sector housing finance company with an AUM of ~
`72,000cr (as on June 30, 2016). The company has a well diversified loan book
with housing loans accounting for the largest share at 72%, followed by LAP (16%),
project loans (9.8%) and loans to SME (2.6%) (as of June 30, 2016).
The company currently has a strong distribution network with pan-India presence
and 2 international representative offices in the UK and the UAE. It operates via a
large distribution network of 362 company operated centers across India and 357
locations through alliance partners with the distribution network focused primarily
on tier II and tier III locations.
July 26, 2016
4
Dewan Housing Finance | 1QFY2017 Result Update
Income statement (standalone)
Y/E March (` cr)
FY2013 FY2014 FY2015
FY2016
FY2017E
FY2018E
NII
678
888
1,256
1,664
2,050
2,500
- YoY Growth (%)
70.0
30.9
41.5
32.5
23.2
21.9
Other Income
280
296
265
164
175
188
- YoY Growth (%)
11.7
5.8
(10.5)
(38.3)
7.1
7.4
Operating Income
958
1,184
1,522
1,828
2,225
2,688
- YoY Growth (%)
47.5
23.6
28.5
20.1
21.7
20.8
Operating Expenses
304
384
480
550
637
731
- YoY Growth (%)
22.3
26.2
25.2
14.5
15.8
14.7
Pre - Provision Profit
654
801
1,041
1,278
1,588
1,957
- YoY Growth (%)
63.1
22.4
30.1
22.7
24.3
23.2
Prov. & Cont.
45
66
99
175
274
311
- YoY Growth (%)
89.9
47.7
48.7
77.4
56.2
13.5
Profit Before Tax
609
734
943
1,102
1,314
1,646
- YoY Growth (%)
61.4
20.5
28.4
16.9
19.2
25.3
Prov. for Taxation
159
206
322
373
449
562
- as a % of PBT
26.1
28.1
34.1
33.8
34.1
34.1
PAT
459
527
620
729
866
1,084
- YoY Growth (%)
60.9
14.8
17.8
17.6
18.7
25.3
Balance sheet (standalone)
Y/E March (` cr)
FY2013 FY2014 FY2015
FY2016
FY2017E
FY2018E
Share Capital
128
128
146
292
292
313
Reserve & Surplus
3,109
3,447
4,490
4,725
5,456
6,850
Loan Funds
27,441
33,890
40,526
49,800
61,730
76,519
- Growth (%)
61.9
23.5
19.6
22.9
24.0
24.0
Other Liab. & Prov.
5,172
6,465
9,557
13,115
15,400
18,246
Total Liabilities
35,850
43,930
54,718
67,933
82,878
1,01,928
Investments
275
721
1,006
1,249
1,524
4,080
Advances
32,403
38,651
48,789
60,572
73,898
88,677
- Growth (%)
77.5
19.3
26.2
24.2
22.0
20.0
Fixed Assets
438
988
985
1,222
1,491
1,834
Other Assets
2,735
3,569
3,938
4,889
5,965
7,336
Total Assets
35,850
43,930
54,718
67,933
82,878
1,01,928
July 26, 2016
5
Dewan Housing Finance | 1QFY2017 Result Update
Ratio analysis (standalone)
Y/E March
FY2013
FY2014
FY2015
FY2016
FY2017E
FY2018E
Profitability ratios (%)
NIMs
2.6
2.4
2.8
2.9
2.9
2.9
Cost to Income Ratio
31.7
32.4
31.6
30.1
28.6
27.2
RoA
1.6
1.3
1.3
1.2
1.1
1.2
RoE
17.4
15.5
15.1
15.1
16.1
16.8
Asset Quality (%)
Gross NPAs
0.73
0.8
1.0
1.1
1.2
1.3
Net NPAs
0.48
0.5
0.7
0.8
0.8
0.8
Provision Coverage
34.2
33.5
28.7
31.5
33.1
38.6
Per Share Data (`)
EPS
17.9
20.5
21.3
24.9
29.7
34.6
ABVPS (75% cover.)
118.7
129.0
143.7
162.0
184.0
215.3
DPS
1.0
1.6
1.1
0.6
0.8
0.9
Valuation Ratios
PER (x)
12.6
11.0
10.6
9.0
7.6
6.5
P/ABVPS (x)
1.9
1.7
1.6
1.4
1.2
1.0
Dividend Yield
0.4
0.7
0.5
0.3
0.4
0.4
DuPont Analysis
NII
2.4
2.2
2.5
2.7
2.7
2.7
(-) Prov. Exp.
0.2
0.2
0.2
0.3
0.4
0.3
Adj. NII
2.2
2.1
2.3
2.4
2.4
2.4
Treasury
0.0
0.0
0.0
0.0
0.0
0.0
Int. Sens. Inc.
2.2
2.1
2.4
2.4
2.4
2.4
Other Inc.
0.9
0.7
0.5
0.3
0.2
0.2
Op. Inc.
3.2
2.8
2.9
2.7
2.6
2.6
Opex
1.1
1.0
1.0
0.9
0.8
0.8
PBT
2.1
1.8
1.9
1.8
1.7
1.8
Taxes
0.6
0.5
0.7
0.6
0.6
0.6
RoA
1.6
1.3
1.3
1.2
1.1
1.2
Leverage
10.9
11.7
12.0
12.7
14.0
14.3
RoE
17.1
15.5
15.1
15.1
16.1
16.8
July 26, 2016
6
Dewan Housing Finance | 1QFY2017 Result Update
Research Team Tel: 022 - 39357800
DISCLAIMER
Angel Broking Private Limited (hereinafter referred to as “Angel”) is a registered Member of National Stock Exchange of India Limited,
Bombay Stock Exchange Limited and Metropolitan Stock Exchange Limited. It is also registered as a Depository Participant with CDSL
and Portfolio Manager with SEBI. It also has registration with AMFI as a Mutual Fund Distributor. Angel Broking Private Limited is a
registered entity with SEBI for Research Analyst in terms of SEBI (Research Analyst) Regulations, 2014 vide registration number
INH000000164. Angel or its associates has not been debarred/ suspended by SEBI or any other regulatory authority for accessing
/dealing in securities Market. Angel or its associates/analyst has not received any compensation / managed or co-managed public
offering of securities of the company covered by Analyst during the past twelve months.
This document is solely for the personal information of the recipient, and must not be singularly used as the basis of any investment
decision. Nothing in this document should be construed as investment or financial advice. Each recipient of this document should
make such investigations as they deem necessary to arrive at an independent evaluation of an investment in the securities of the
companies referred to in this document (including the merits and risks involved), and should consult their own advisors to determine
the merits and risks of such an investment.
Reports based on technical and derivative analysis center on studying charts of a stock's price movement, outstanding positions and
trading volume, as opposed to focusing on a company's fundamentals and, as such, may not match with a report on a company's
fundamentals. Investors are advised to refer the Fundamental and Technical Research Reports available on our website to evaluate the
contrary view, if any.
The information in this document has been printed on the basis of publicly available information, internal data and other reliable
sources believed to be true, but we do not represent that it is accurate or complete and it should not be relied on as such, as this
document is for general guidance only. Angel Broking Pvt. Limited or any of its affiliates/ group companies shall not be in any way
responsible for any loss or damage that may arise to any person from any inadvertent error in the information contained in this report.
Angel Broking Pvt. Limited has not independently verified all the information contained within this document. Accordingly, we cannot
testify, nor make any representation or warranty, express or implied, to the accuracy, contents or data contained within this document.
While Angel Broking Pvt. Limited endeavors to update on a reasonable basis the information discussed in this material, there may be
regulatory, compliance, or other reasons that prevent us from doing so.
This document is being supplied to you solely for your information, and its contents, information or data may not be reproduced,
redistributed or passed on, directly or indirectly.
Neither Angel Broking Pvt. Limited, nor its directors, employees or affiliates shall be liable for any loss or damage that may arise from
or in connection with the use of this information.
Disclosure of Interest Statement
Dewan Housing Finance
1. Financial interest of research analyst or Angel or his Associate or his relative
No
2. Ownership of 1% or more of the stock by research analyst or Angel or associates or relatives
No
3. Served as an officer, director or employee of the company covered under Research
No
4. Broking relationship with company covered under Research
No
Ratings (Based on expected returns
Buy (> 15%)
Accumulate (5% to 15%)
Neutral (-5 to 5%)
over 12 months investment period):
Reduce (-5% to -15%)
Sell (< -15)
July 26, 2016
7